

First, I must apologize to my subscribers. It’s been a while since my last post was written. I don’t want to just publish something for the sake of publishing. Your time is valuable and scarce, and since you decided to share that time with me and read my posts, I want to make sure that the content is valuable.
I haven’t written anything super technical lately, and nobody wants to read about AI, so when the inspiration finally came, this post was born.
A big part of the pre-sales engineer’s or solution architect’s job in IT is sizing the solutions that we provide our customers. And sizing for capacity is pretty easy, or easier, but the more scientific piece of this job is sizing for performance.
If you are a customer, or ever worked at a legacy storage vendor, or had to sell legacy storage solutions, you always knew the rule of thumb. In reality it was not a rule, just simple math. If your system had two active controllers, or storage processors as EMC used to call them, both were processing I/O and both were carrying half the load. If one of the controllers went offline, the surviving peer would be responsible for everything.
If both storage processors were running at 51% each, the survivor would be asked for 102% of what it can do. There is no magic - if that happened, the logic in the software was quite simple - degraded service, higher latency, and in some really bad edge cases, taking some of the workloads offline to free up resources.
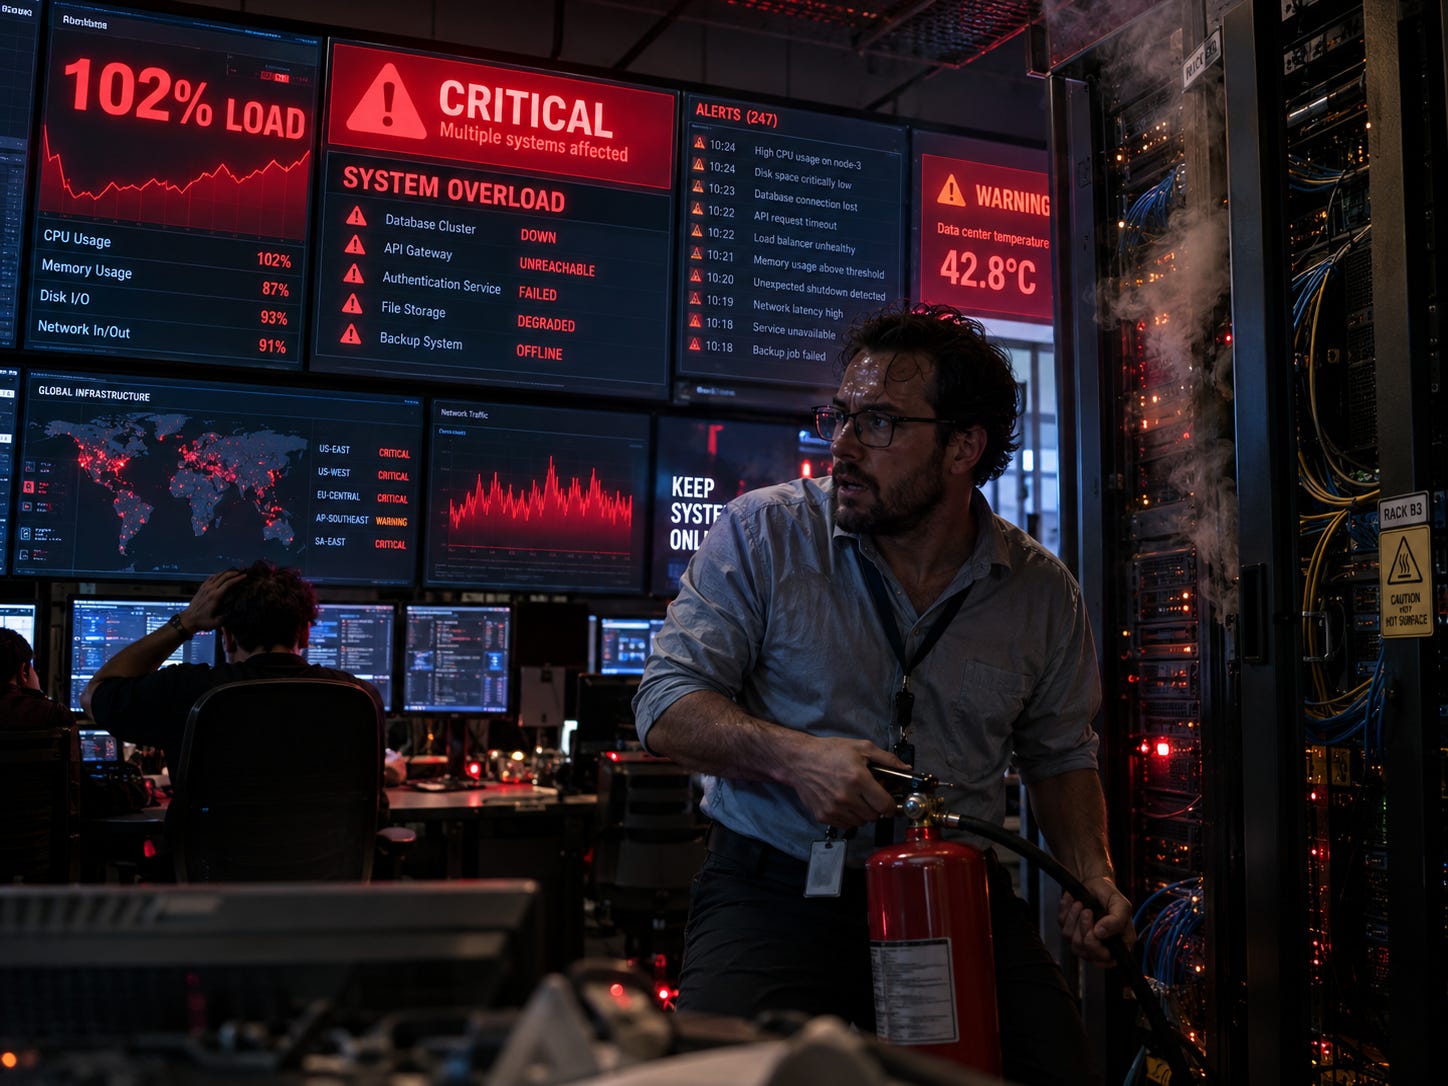
If you have been the storage administrator or director of IT for the past 20 years, you knew that you did not want your storage arrays to cross that load-bearing hard limit of 70% utilization. Anyone who ignored it eventually learned why it was there. And as the story goes, this never happened during office hours. Does 2AM sound familiar to any of you?
I don’t work for marketing at Everpure (formerly Pure Storage). For the past 25+ years I have always been on the engineering side: NetApp (formerly Network Appliance, see what I did there?), Reduxio and now Everpure. So everything I say here is based on firsthand experience.
Back to that performance number. The trouble with that number is that it outlived the machine it was calculated for, just like inherited metrics usually do. Nobody bothered to recalculate it. It just came along.
Yesterday I had a meeting with an existing Everpure partner who was looking at the performance graph in Pure1 for their end user, and for anyone who has been doing this for a long time, it looked scary.

Obviously they were concerned, and I don’t blame them.
I used to address concerns like this as a systems engineer. These days I serve a team of pre-sales engineers across the Northeast and Mid-Atlantic, which mostly means I get pulled into the version of the conversation that has already gone somewhere unproductive. I understand the confusion - people are looking at an Everpure array with a gauge they learned on an old one, and nobody ever told them the meter changed meaning.
Now I am getting to the actual technical story. Enough with the suspense and the scary pictures. Remember, I do work for Everpure, so weigh that fact however you like.
From the very beginning, Pure Storage took a different engineering approach to performance management and CPU and memory utilization.
Here is the fact that changes this conversation - by design the CPU utilization is always 100%. All the time, not at peak, not under stress. Always.
The only technical difference between the array that is working hard and the one that is doing nothing is which particular process is consuming the CPU cycles. I hope this is not a surprise, but the priority is given to the processes that are serving the application I/O. When the array is not busy processing I/O, it is using the cycles to go over the data that is already on the array, improving data reduction and optimizing metadata so the future I/O is faster.
A CPU graph, if we were to expose it, would show 100% usage forever, and essentially would tell you absolutely nothing. It is a very elegant demonstration that the metric we are used to looking at first is the wrong one here.
So what we built instead was load. One number, described by the engineer who worked on it as a combination of busyness and utilization across all the subsystems that make up the array. Elsewhere it is described more plainly as taking in front-end workload, background tasks, and replication, and reporting all of it as a single percentage, sampled every three minutes and kept for thirty-five days.
In the legacy days the only way to discover you had exceeded an array's performance limit was when I/O latency started to spike. The blog uses this metaphor - driving toward a cliff you cannot see until you are already falling.
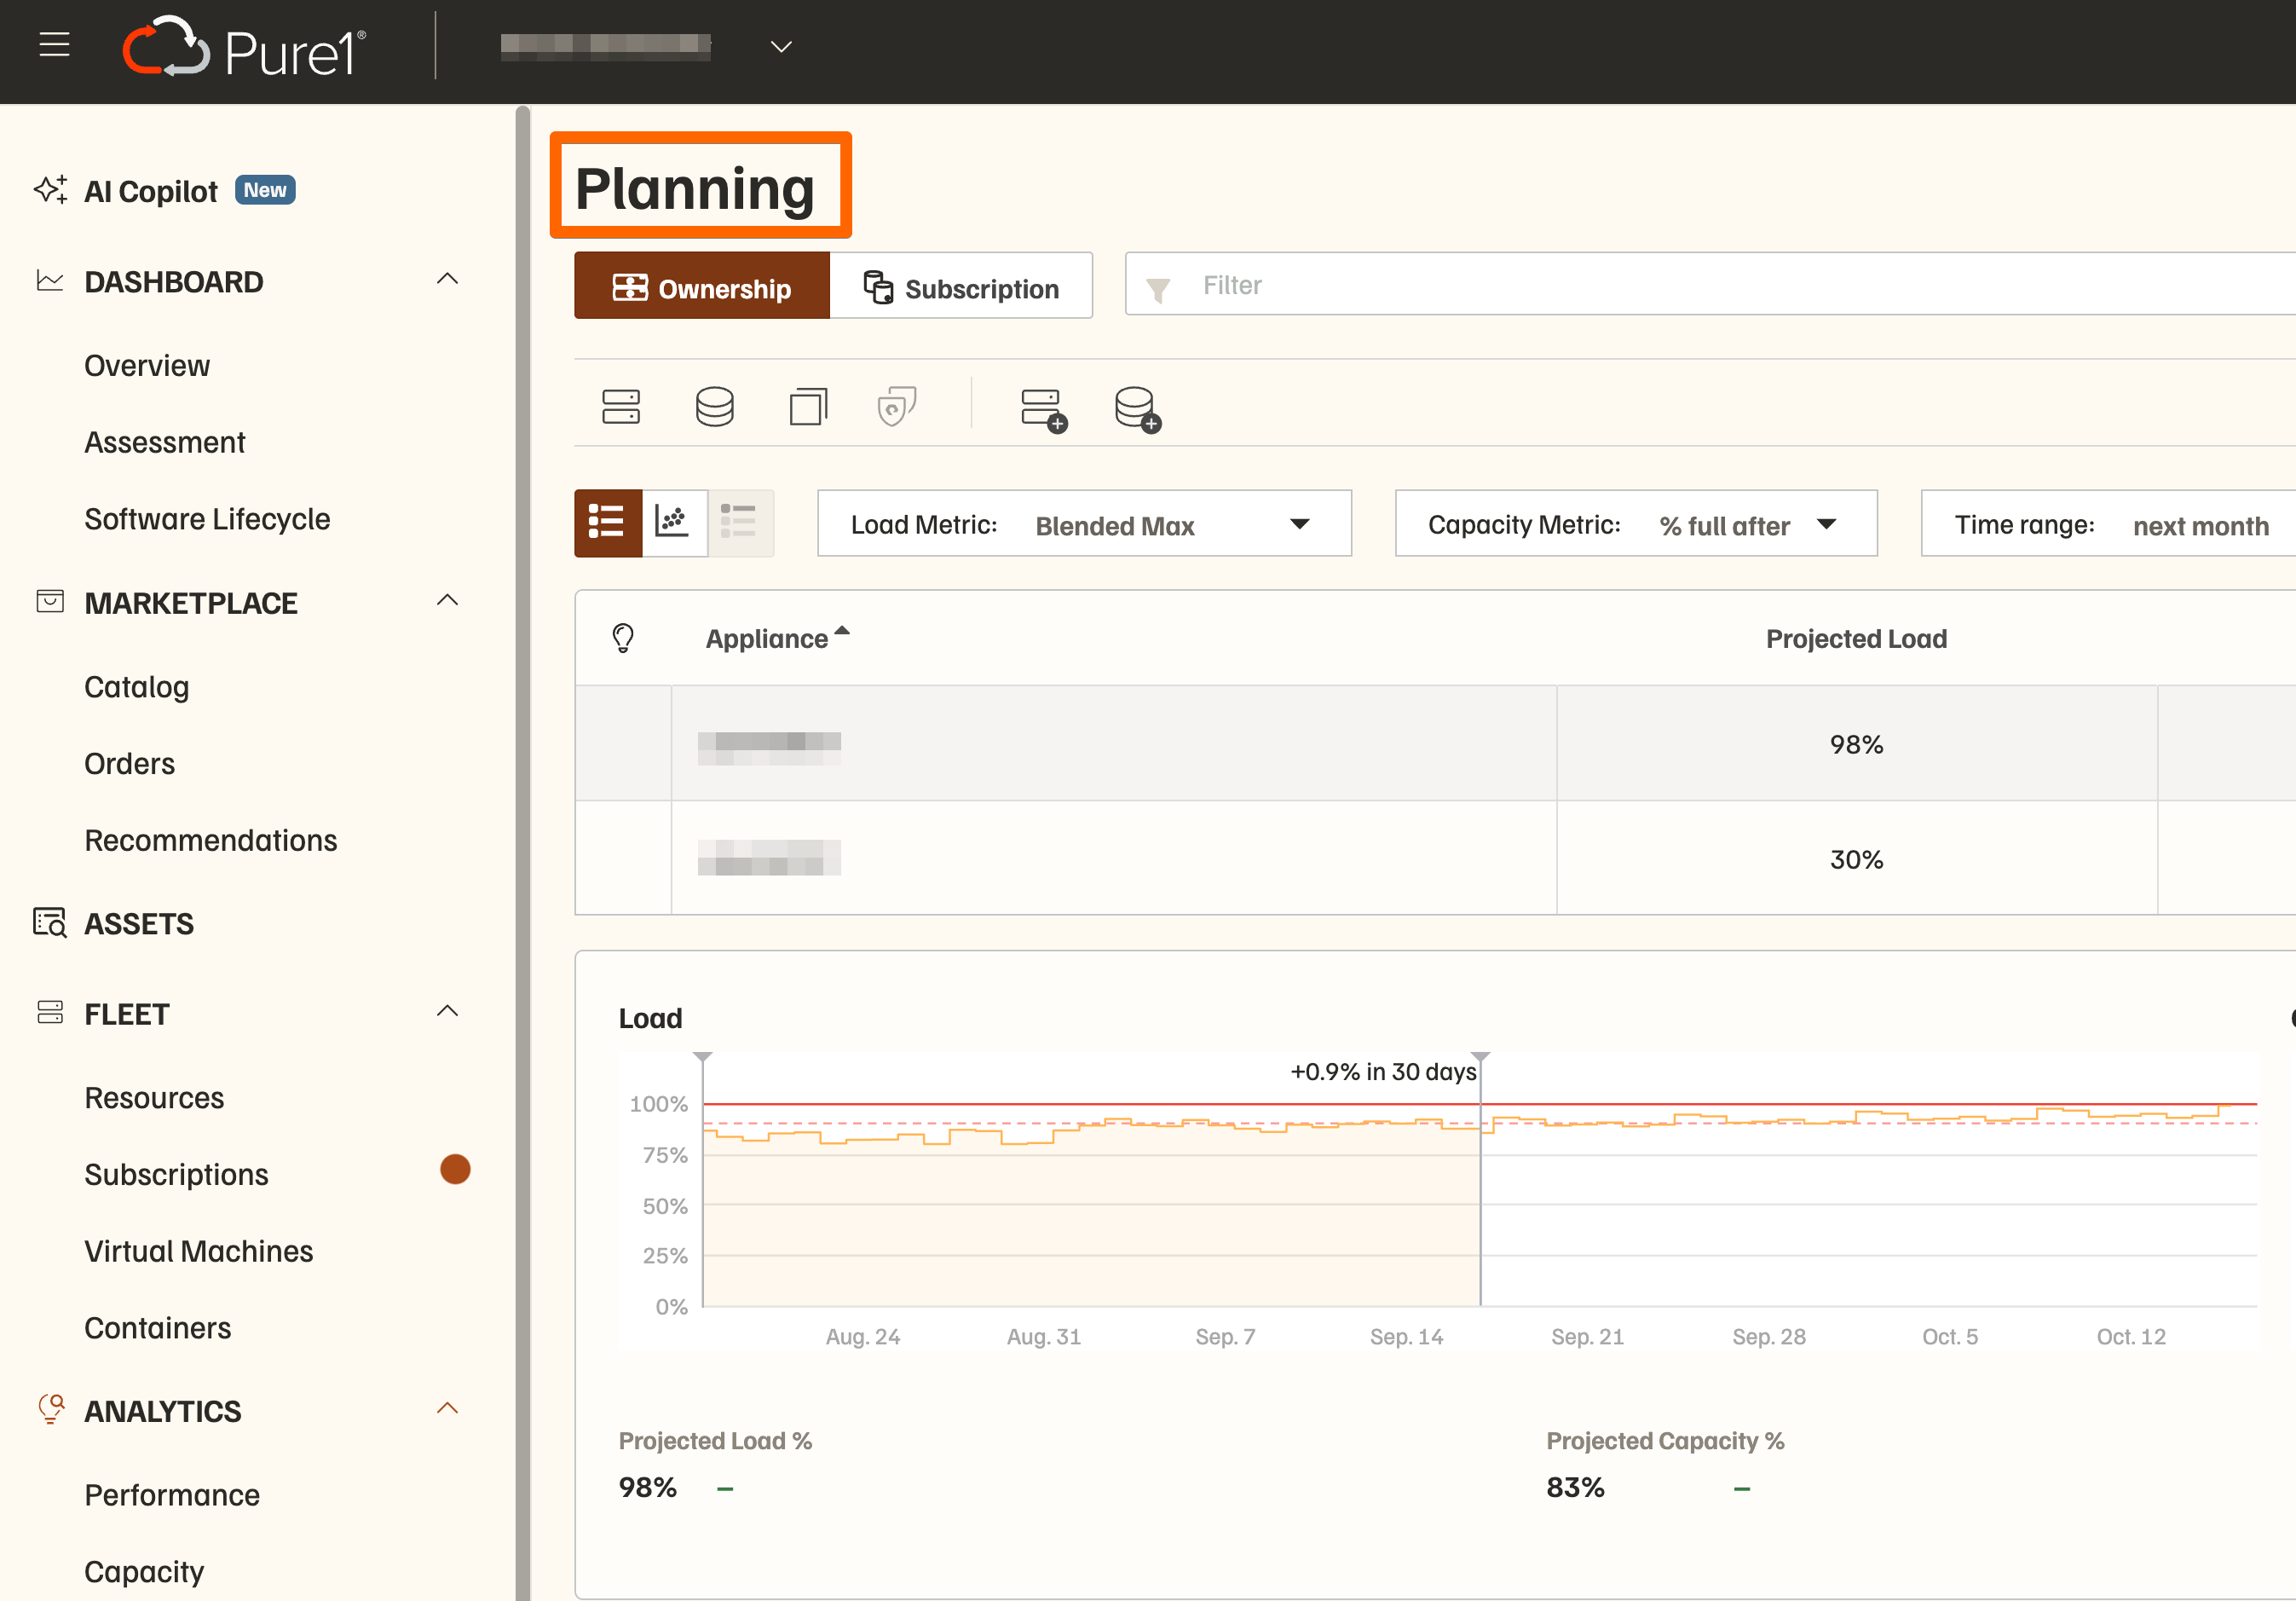
Two properties of the “load” number cause the most confusion I have run into in the last eight years or so. First of all it is not linear. This is stated outright in the same blog: grow the workload by 20% and the load figure will not necessarily grow by 20%. That cuts both ways. A fifty percent reading does not mean you have room for exactly one more of whatever you are currently running, and it also means the confident or possibly anxious extrapolation people do in their heads, taking seventy and adding a project, is not arithmetic. It is just a guess. The Workload Planner exists precisely because that guess needed replacing with something modeled from telemetry rather than from a mental image.
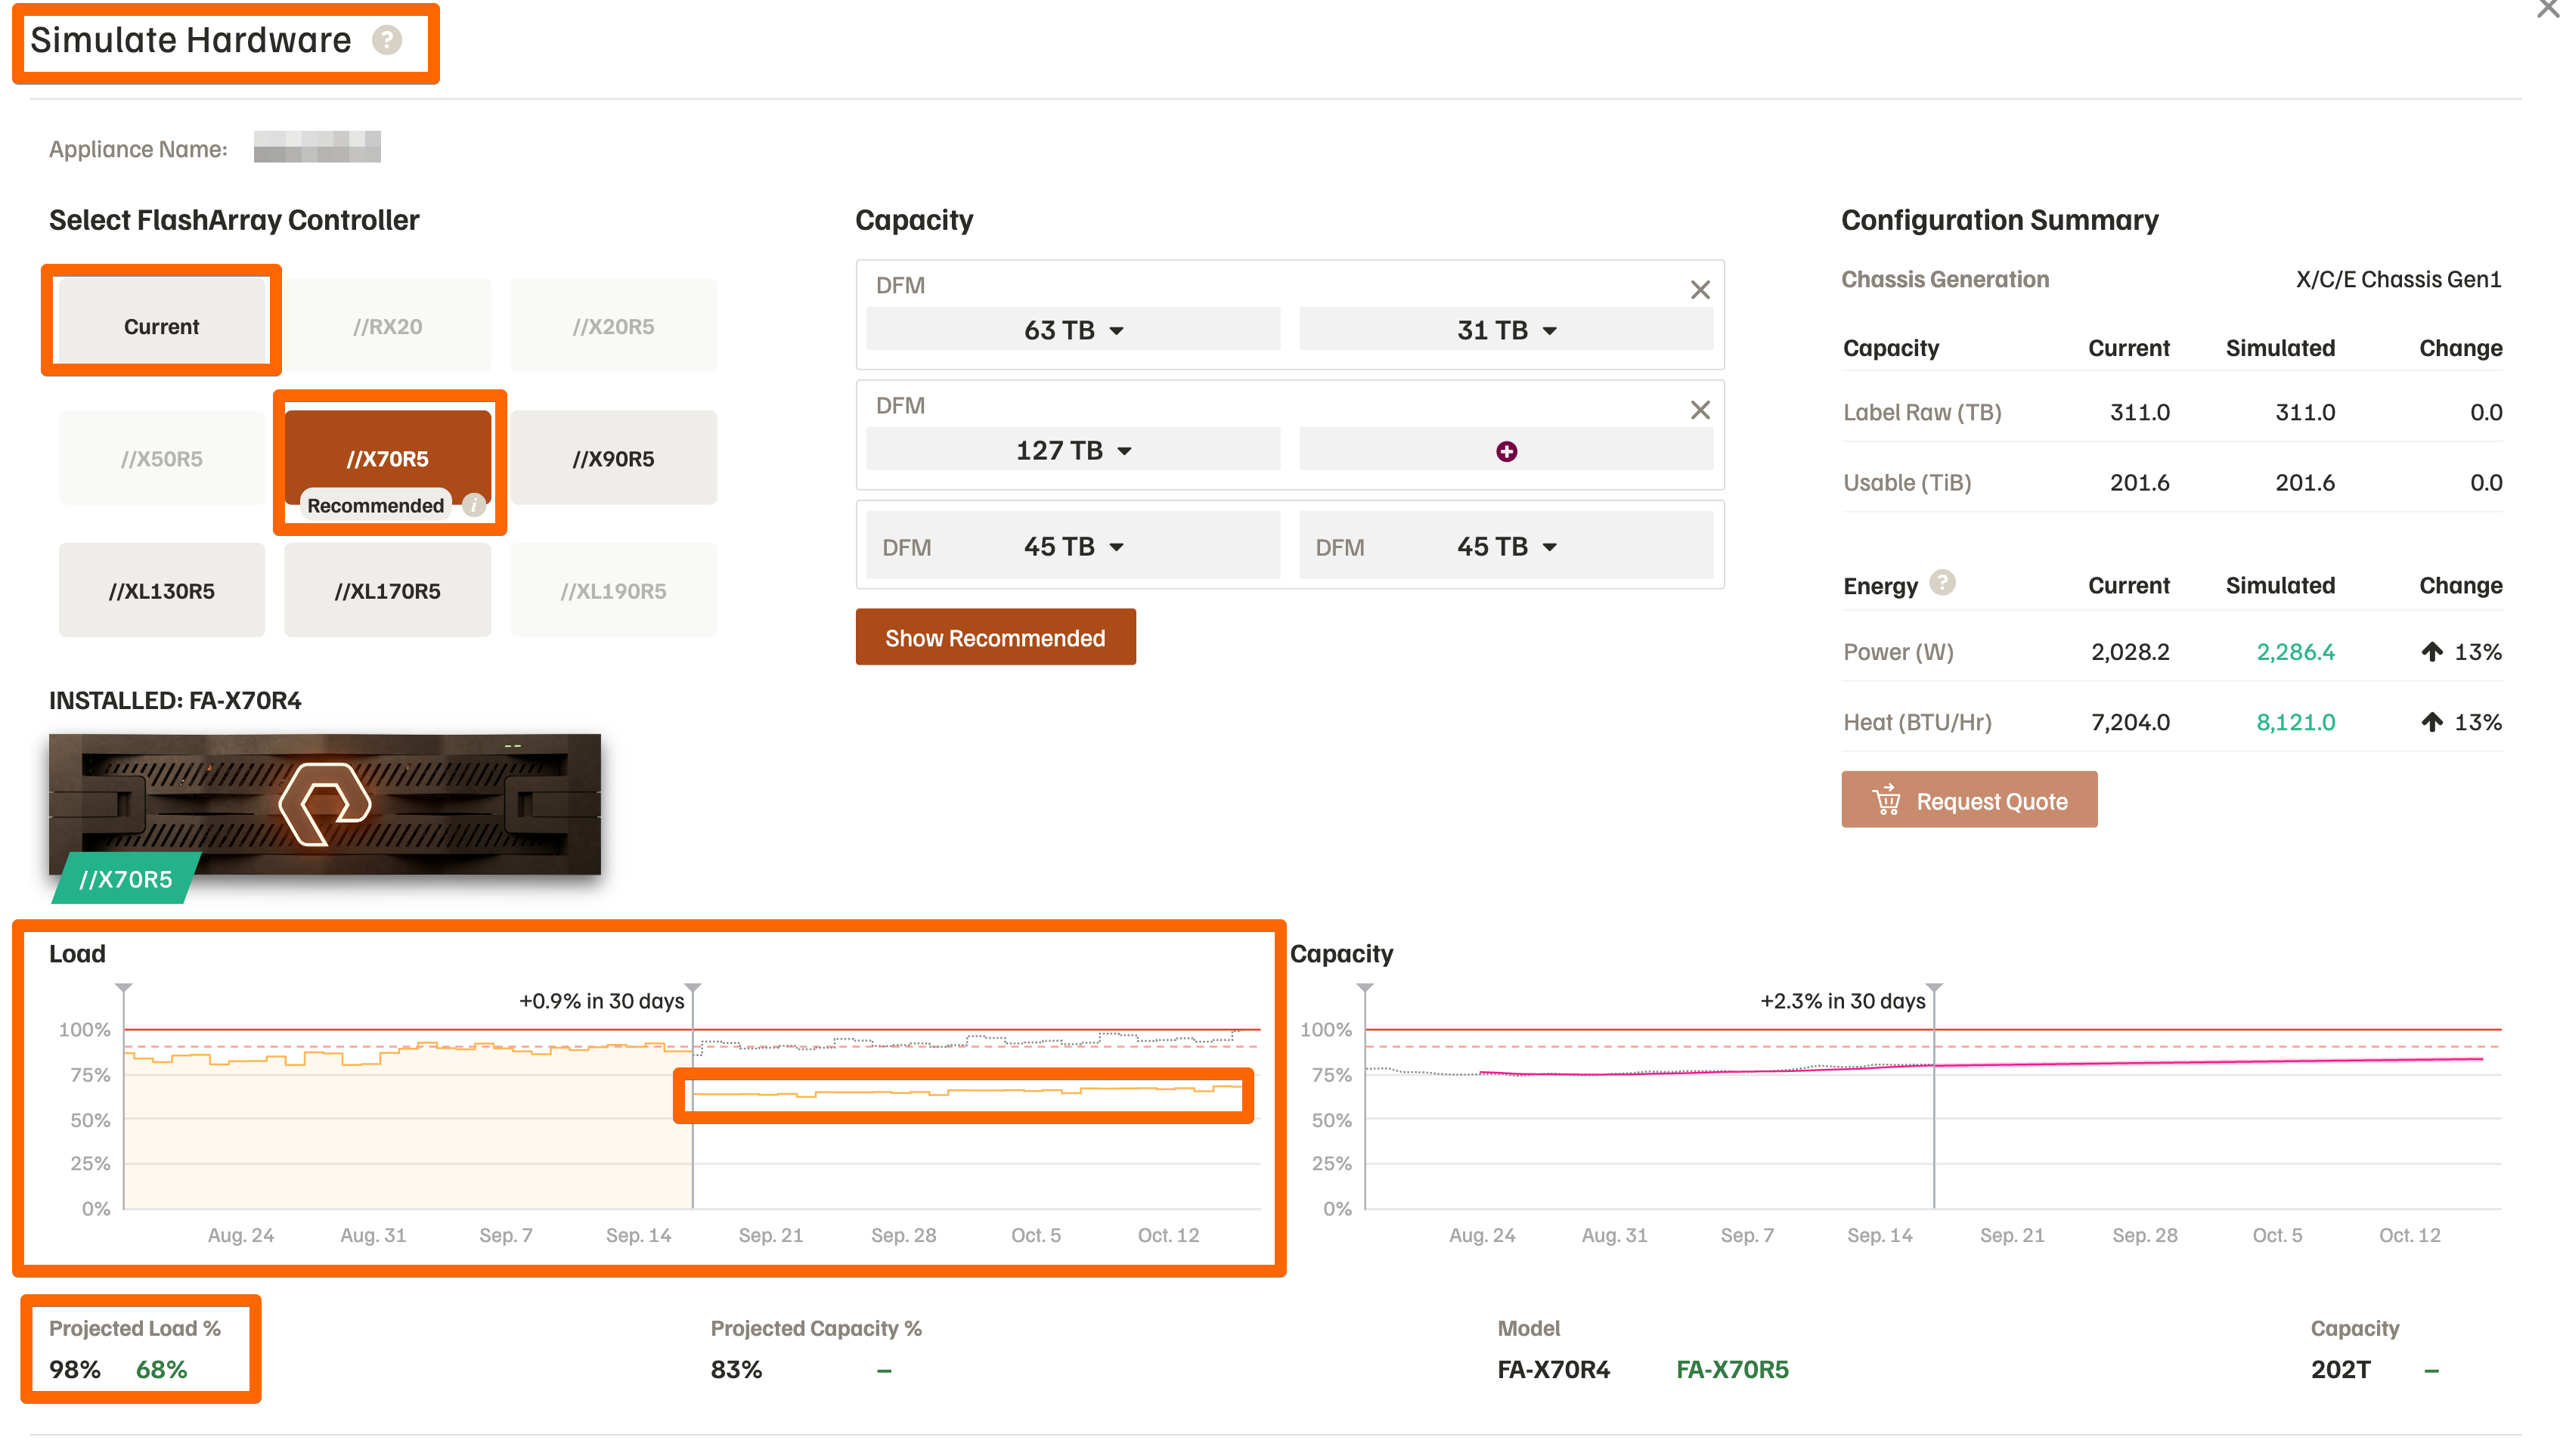
As you will see in the image below, based on empirical data collected from a production system, the workload planner shows what will happen to that load if the customer simply upgrades the controllers to the latest generation. Notice how the load of 98% drops to 68% just by virtue of upgrading the controller.
The second property is that it is array-wide. The original calculation method could not tell you what came from a SQL database and what came from a VDI farm or a file share. Everything was calculated based on the ratio of the process run times. To Everpure’s credit this is exactly the reason why the machine learning algorithm was built. The inputs are metrics like write IOPS, which can both be attributed to the workload generating them and projected forward. People tend to think of the total, and that is probably the least actionable number.
The Part Where I Had To Correct Myself
For years I have explained the failover story to partners and customers this way: each controller in the pair is designed to handle 100% of the performance, which is why you can pull one out of a running array and not see a blip. The conclusion is right. Everpure publishes that there is no degradation of performance when a controller fails, and non-disruptive upgrades are possible during business hours with no end user impact.
It’s a really cool pre-sales story, but if you are an engineer, you may think you have two controllers that both work and are each individually big enough to handle everything, which would mean the pair has twice the capability of one. Well, then a logical question would be why they are overpaying for a solution where half of it is never even used?
Let me humbly correct my story publicly - that is not the design. FlashArray is active/active for connectivity, so both controllers accept and process I/O from the hosts, but write processing happens on one primary while the secondary maintains a DRAM mirror of every transaction moving through the array. The engineering decision, made in 2009, was that one controller should be able to service all the I/O and the second should be present to take over.
The difference matters more than it sounds. The legacy arithmetic exists because work is split and then has to be reassembled on one survivor. Here it was never split, so there is nothing to reassemble and the survivor is not being asked for 102% of anything. That rule of 70% is no longer needed.
Do Not Oversell
High load is not nothing. As a creative writer I am tempted to stop here where it is still comfortable. But the engineer in me would not allow this to happen.
Every controller has limits, and ignoring the load warning makes those limits harder to see. Writes are acknowledged out of DRAM and NVRAM and flushed to flash media asynchronously, which is where the low write latency comes from, but the data still has to reach flash eventually, and sustained write pressure meets that limit no matter how fast the acknowledgement was.
So when a partner asks whether seventy percent is safe, the answer is not that load does not matter. It is that load is a busyness and health indicator, and the thing end users will feel is latency. Purity’s stated design philosophy here is about as strong as software documentation ever gets:
Performance variability is treated as a failure, and parity is used to work around bottlenecks in order to deliver consistent latency.
If the array is busy and latency is holding, the users are fine and the graph is telling you that you bought the right amount of array. If latency is moving, the graph was never the thing to argue about.
My favorite evidence for that is accidental. In a 2019 tutorial, Pulling Performance Statistics from Pure1 with PowerShell, Cody Hosterman needed to show what a returned data point looks like, so he used one from his own array. It reads 87.37% busy. He mentions it the way you would mention a timestamp, because the post was about the API call and not about the number. A legacy storage admin reading that sentence has an involuntary twitch. The person who wrote it did not think twice.
The Old Habit, Not The Number
So what did I tell the partner? Not that the graph was wrong, because it was not. I asked him to open the latency chart next to it. When he did, the peak latency was consistently in the 0.1 to 0.37 millisecond range.
Seventy percent of what, then? Of the array's ability to do the particular mix of work it happens to be doing at that moment. Which is a moving target, not a ceiling.
That answer may not be the one you are looking for, but I think it is the right one, because a number that behaves like that does not deserve a threshold. It deserves a second data point like latency beside it, showing what the end users actually experience.
The habit is the harder problem. After 25 years I still reach for the old gauge first. The difference is that now I check what it is measuring before I let it scare me, or scare my customer.
I appreciate you reading.
Dmitry Gorbatov
© 2025 Dmitry Gorbatov | #dmitrywashere